
Abdominal Obezite ve Nonalkolik Steatohepatit Arasindaki İlişki
Cilt 20, Sayı 6
Aralık 2006 · Sayfalar 397-402
Abdominal Obezite ve Nonalkolik Steatohepatit Arasindaki İlişki
Relationship Between Abdominal Obesity and Nonalcoholic Steatohepatitis
Mehmet YALNIZ1, Huseyin ATASEVEN1, İbrahim H.BAHÇECİOGLU1, İbrahim ÖZERCAN2, İsmail ÇİFTCİ3
2Firat University Faculty of Medicine Department of Pathology Elazığ –TÜRKİYE
3Firat University Faculty of Medicine Department of Nuclear Medicine Elazığ –TÜRKİYE
Obezite hepatik steatoz ve fibrotik karaciğer hastalığının iyi bilinen bir risk faktörüdür. Bunun yanında, abdominal yağ dağılımı hepatik steatoz da dahil obeziteye eşlik eden metabolik anormalliklerin habercisidir. Bu çalışmada, vücut yağ dağılımı ile nonalkolik steatohepatit (NASH) arasındaki ilişki araştırıldı.
Biyopsi ile tanı almış 25 NASH hastası ve 24 yaş, cinsiyet ve vücut kitle indeksi (VKİ) ile uyumlu sağlıklı kontrol çalışmaya dâhil edildi. Hastalar VKİ’lerine göre ikiye ayrıldı: Group I: VKİ<30 (n=17), Group II: VKİ≥30 (n=8). Total vücut yağı (TVY) ve trunkal yağ (TY) Dual-enerji X-ray absorptiyometre (DEXA) ile ölçüldü. Abdominal obezite, (TY/TVY) x100 formülü ile hesaplanan TY yüzdesi ile değerlendirildi.
VKİ, TVY ve TY; kontrol ve NASH gruplarında benzerdi. Fakat TY/TVY oranı NASH hastalarında kontrol grubundan anlamlı olarak yüksekti (p<0.05). Aynı şekilde, Grup I ile kontrol grubu hastalarında VKİ, TVY ve TY değerleri arasında anlamlı bir farklılık yokken, sadece TY/TVY oranı Grup I’de kontrol grubundan anlamlı olarak yüksekti (p<0.01). TY/TVY oranı Group II’de (51.9±3.1%) de kontrol grubundan (49.9±5.9%) yüksekti fakat bu yükseklik anlamlı değildi. Histopatolojik şiddet açısından NASH ile TY/TVY arasında ise anlamlı bir ilişki bulunmadı (p>0.05).
Abdominal obezite ile NASH arasında, özellikle de henüz aşikâr obezite gelişmemiş hastalarda daha belirgin olmak üzere, anlamlı bir ilişki mevcuttur.
Obesity is a well established risk factor for hepatic steatosis and fibrotic liver disease. Nevertheless, abdominal fat distribution predicts metabolic abnormalities associated with obesity including hepatic steatosis. We aimed to investigate the relationship between body fat distribution and nonalcoholoic steatohepatitis (NASH).
25 patients with biopsy proven NASH and age-, sex-, and body mass index (BMI) matched 24 healthy individuals were studied. Patients divided into two groups according to BMI: Group I: BMI<30 (n=17), Group II: BMI≥30 (n=8). Total body fat (TBF) and trunkal fat (TF) were assessed using Dual-energy X-ray absorptiometry. Abdominal obesity was estimated by the percentage of TF, which is determined by (TF/TBF) x100.
The BMI, TBF, and TF were comparable in the control and NASH groups. TF/TBF ratio in patients with NASH, however, was significantly higher than that in the control group (p<0.05). Similarly, only TF/TBF ratio was higher in Group I than in the control group (p<0.01), although the BMI, TBF and TF values were comparable (p>0.05). The TF/TBF ratio in Group II (51.9±3.1%) was also higher than in the control group (49.9±5.9%) but the difference was not significant (p>0.05). Concerning the histopathological severity, neither grade nor stage of the patients with NASH was correlated with TF/TBF ratio (p>0.05).
Abdominal obesity is closely associated with NASH, in particular in non-obese overweight or lean patients.
Giriş
Nonalcoholic fatty liver disease (NAFLD) caused by the intrahepatic accumulation of lipids accounts for the majority of asymptomatic subjects with abnormal liver function tests [1]. In addition, nonalcoholic steatohepatitis (NASH), along with other forms of NAFLD, is a well recognized cause of progressive liver disease [2,3]. Approximately half of the patients with NASH develop liver fibrosis, 15% develop cirrhosis, and 3% may progress to liver failure or liver transplantation [4]. Both early [5,6] and recent studies [7,8] have proved obesity as a risk factor for hepatic steatosis and fibrotic liver disease.It has been proposed that lipid ladden hepatocytes act as a reservoir of hepatotoxic agents and are more susceptible to a second hit injury by compounds such as endotoxin and tumor necrosis factor alpha [9,10]. This leads to lipid peroxidation; a process that stimulates fibrogenesis [2]. The distribution of body fat, however, has been claimed to be more important than total fat mass in the pathogenesis of NASH [2,3]. Abdominal (truncal) fat distribution predicts abnormalities such as diabetes and dyslipidemia as well as hypertension and stroke, all of which are associated with obesity [11]. Moreover, visceral fat, but not total fat mass, has been revealed to be a predictor of hepatic steatosis in some studies [2,11]. The relationship between the abdominal obesity and NASH, however, has not been established well yet.
Effective methods assessing the abdominal fat are essential to investigate its role in the increased health risks in obesity. Techniques for direct measurement of soft tissue composition such as computed tomography or magnetic resonance imaging are expensive, time consuming or require a relatively high radiation dose [12]. Dual-energy X-ray absorptiometry (DEXA), a noninvasive technique, however, allows the simultaneous measurement of the three body compartments using a body scanner [13]. It is a reliable and convenient research tool used to explore the indices of fat mass distribution, which are most informative with respects to predicting the various parameters of the metabolic syndrome [14].
The objective of this study was to investigate the relationship between the NASH and body fat composition along with its distribution using DEXA.
Gereç ve Yöntem
The present study consisted of 25 consecutive patients with NASH proven by histopathological examination and had high alanine and aspartate aminotansferase (ALT, AST) levels at Fırat University, Gastroenterology Clinic.The diagnosis of NASH was based on the following criteria:
(1) Presence of steatosis (>10%), lobular inflammation, and ballooning degeneration (with or without fibrosis) on liver biopsy;
(2) Intake of less than 20 gr of ethanol per week, as confirmed by the physician and family members who were in close contact with the patient; and
(3) Appropriate exclusion of other liver diseases such as alcoholic liver disease, viral hepatitis, autoimmune hepatitis, drug-induced liver disease, primary biliary cirrhosis, primary sclerosing cholangitis, biliary obstruction, and metabolic liver diseases. No patient had a history of jejunoileal by-pass.
24 age-, sex-, and body mass index (BMI) matched individuals who had normal abdominal ultrasound liver scans, normal transaminase values, normal fasting serum glucose levels, and normal glucose tolerance tests served as the control group.
Informed consent was obtained from each patient and the study protocol conforms to the ethical guidelines of the 1975 Declaration of Helsinki as reflected in a priori approval by the institution’s human research committee. Local ethic comittee approved the study.
Histopathological grading and staging of the NASH was made according to Brunt’s criteria [15] by a specialist pathologist, who also made the histopathological diagnosis of the NASH.
Grading: Grading was made according to macrovesicular steatosis and necroinflammatory activity.
Macrovesicular steatosis:
Grade 0: No steatosis;
Grade 1: Steatosis up to 33%;
Grade 2: Steatosis between 33 and 66%;
Grade 3: Steatosis over 66%.
Necroinflammatory activity:
Grade 1: Mild;
Grade 2: Moderate;
Grade 3: Severe.
Staging: Staging was made according to fibrosis.
Stage 1: Zone 3 perisinusoidal / pericellular fibrosis; focal or diffuse;
Stage 2: Focal or diffuse periportal fibrosis together with Zone 3 perisinusoidal / pericellular fibrosis;
Stage 3: Focal and diffuse bridging necrosis together with perisinusoidal / pericellular fibrosis and portal fibrosis;
Stage 4: Cirrhosis.
Laboratory Analyses: Blood samples were collected from patients and control group after an overnight fasting. AST, ALT, total protein, albumin, alkaline phosphatase, γ-glutamyl transpeptidase, HbsAg, antiHCV, antinuclear anticor, smooth muscle antibody, antimitochondrial antibody, serum cholesterol, triglyceride, fasting glucose levels and complete blood count were studied.
Patients with fasting serum glucose levels of more than 126 mg/dl in at least two seperate samples were identified as having diabetes mellitus, and a finding of 140-200 mg/dl two hours after the standard oral glucose loading was considered abnormal glucose tolerance test.
As a measure of overweightness and/or obesity, Body Mass Index (BMI) was calculated as the weight (kg) divided by the square of height (m2) in all participants and the patients with BMI of more than 30 were considered to show manifest obesity according to the World Health Organization classification [16]. Patients divided into two groups according to the BMI: Group I: BMI<30 (n=17) Group II: BMI≥30 (n=8).
DEXA measurements: Total and regional body fat were taken at nuclear medicine department using Lunar DPX-L scanner (Lunar Radiation, Madison, WI). The data obtained from DEXA were further evaluated using the Lunar 1.3 V program, which allows the operator to determine specific body regions. The soft tissue assessments were the total and trunkal fat mass (kg). The trunk region consists of the area bordered by a horizontal line below the chin, vertical borders lateral to the ribs and oblique lines passing through the femoral necks, includes chest and abdomen, excluding pelvis. Abdominal obesity was estimated by the percentage of trunkal fat, which determined by dividing the weight of trunkal fat mass by the total amount of body fat [17].
Statistical analysis: Data were initially analyzed using the MannWhitney U-test for independent samples and the Kruskal-Wallis test for comparison among the subgroups (Group I and II) and controls. The relationships among the variables were analyzed using Spearman correlation test. All analyses were performed using the Statistical Package for the Social Sciences (SPSS) for Windows, version 10. P values of less than 0.05 were considered statistically significant.
Bulgular
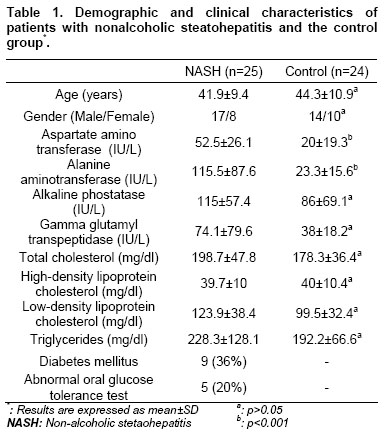
The demographic and clinical characteristics of the patients and controls were comparable (p>0.05 for all) except for AST and ALT. Data presenting the demographic and clinical characteristics of the patients and controls are shown in Table 1. In histopathological examination, most of the patients had grade 2 macrovesicular steatosis (56%) and stage 2 fibrosis (64%). Cirrhosis was not found in any of the patients.
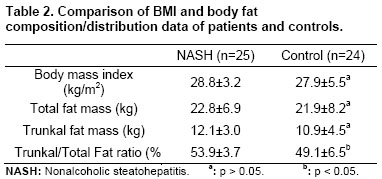
Body fat composition and fat distribution: The BMI, total and trunkal fat mass were comparable in both NASH and control groups (p>0.05 for all). Trunkal/total fat mass ratio however, was significantly higher in patients with NASH than that in the control group (p<0.05). BMI, body fat composition and distribution data in the patients and controls are shown in Table 2.
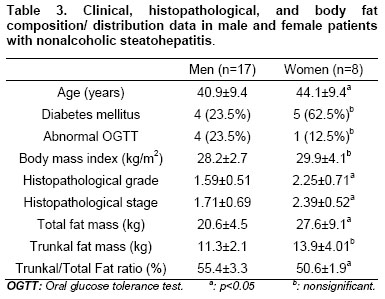
BMI and trunkal fat mass values were comparable in female and male patients (p>0.05). Nevertheless, the trunkal fat/total fat ratio, an indicator of abdominal obesity, was significantly higher in the male patients (55.4±3.3%) than in the female patients (50.6±1.9%) (p<0.05) though the total fat mass was significantly higher in the female patients (p<0.05). Clinical, histopathological, and body fat compositon/distribution data in the male and female patients are shown in Table 3.
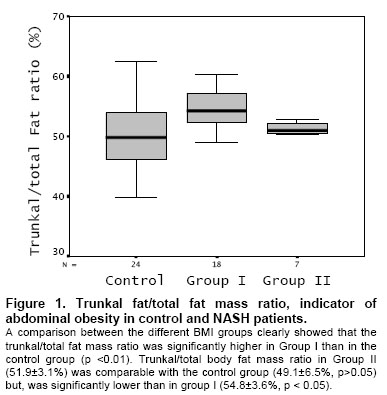
A comparison between the different BMI groups showed the total body and trunkal fat mass values of Group I and the control group to be comparable (p>0.05 for all), while the trunkal/total fat mass ratio was significantly higher in Group I than in the control group (p <0.01). Additionally, total and trunkal fat mass values were significantly higher in Group II compared to either Group I or the control group. However, trunkal/total body fat mass ratio in Group II (51.9±3.1%) was comparable with the control group (49.1±6.5%, p>0.05) but, was significantly lower than in group I (54.8±3.6%, p < 0.05). No significant difference was found between Group I and II with regard to histopathological grade and stage (p>0.05 for each), even though the mean BMI was significantly higher in Group II than in Group I (p<0.001). Clinical, histopathological, and body fat composition distribution data in group I, group II, and the control group are shown in Table 4. Trunkal/total fat ratio in control and NASH groups are also shown in figure 1.
Relationship between body fat composition/
distribution and histopathological severity: Trunkal fat
mass was significantly correlated with histopathological
grade (r=0.415, p<0.05), but not with histopathological
stage (p>0.05). However, neither total body fat mass nor
trunkal/fat ratio was correlated with histopathological
severity (p>0.05 for each).
Females displayed a significant correlation to both
histopathological grade (r=0.461, p<0.05) and stage
(r=0.402), p<0.05) whereas histopathological severity
was not significantly correlated with the AST/ALT ratio,
age and BMI (p>0.05).
The first study concerning the relationship between
the fatty liver and body fat tissue topography was carried
out by Kral et al. [11]. In this uncontrolled study it was
claimed that the risk of fatty liver development increased
in individuals whose fat was distributed to the abdominal
site. However, this [11] and two recent studies [1,22]
reporting this association were conducted in patients with
NAFLD. An association between histopathologically
proven NASH and abdominal obesity has not been
established well yet.
In the present study, we found a close relationship
between the abdominal obesity and NASH. This was
prominent particularly in non-obese patient group (group
I), though BMI of this group was comparable with the
control group. This result clearly indicates the presence
of a strong association between the abdominal obesity
and hepatic steatosis, in particular, in cases where there
is no obvious obesity. This finding also provides further
evidence why some non-obese individuals (physically
lean but metabolically obese due to abdominal (trunkal)
distribution of the fat), in particular in the Asian-Pacific
region, develop NAFLD/NASH [23].
A relationship between abdominal fat distribution and
the histopathological severity of the patients with NASH
was also evaluated in the present study. Trunkal site fat
amount had a positive correlation with histological grade.
The trunkal/total fat ratio, an accurate indicator of the
abdominal obesity, however, did not show any
correlation with the histopathological grade nor with the
stage of patients with NASH. Although the effect of
abdominal obesity upon the histopathological severity of
NASH cannot be ruled out with these results, it seems
that the factors other than insulin resistance also play a
vital role upon the histological severity of NASH.
In contrast, Dixon et al. [24] established that
abdominal (trunkal) weight distribution and some
characteristics of metabolic syndrome were significantly
related with NASH and hepatic fibrosis. However, this
mentioned study has the disadvantage of the study
group being composed of severely obese patients with
an average BMI>35. Thus, the findings of this study
cannot be generalized so as to include patients with a
lower BMI. In this context, the lack of the patients with
higher BMIs (>35) might be thought as a relative
limitation of the present study. However, although there
is yet no epidemiologic study from our country
demonstrating the demographic characteristics of the
patients with NASH, these patients in Turkey are
generally not severely obese as comparable to the
present study. Nevertheless, we could also not show a
relationship between the abdominal fat distribution and
histopathological severity even in patients with higher
BMIs (in Group II, BMI>30).
In the current study the BMI was not correlated with
the histopathological severity either. Some studies in the
literature, however, report that there is a close correlation
between the BMI and histopathological severity. But
these studies defined obesity differently and were
composed of patients with BMIs over 30, 35 and 40,
respectively [7,8,25]. In our study WHO criteria [16] were used in defining the obesity. Besides, Dixon et al.
[24] and Shimada et al. [26] reported results consistent
with our study, in which there was also no significant
relationship between the BMI and the histopathological
stage of the disease. The relationship between the BMI
and histopathological severity is mostly observed in
severely obese patients with a high BMI and should not
be applied to all obese people.Taken together; the effect
of abdominal obesity and the BMI upon histopathological
severity of NASH should be established in patients with a
wide variety of BMIs.
Most of our NASH patients were males in which
abdominal obesity was prominent. Nonetheless, the
females, not males, showed a positive correlation with
the histopathological severity (indicating fibrosis) in
consistent with many of the studies in the literature [7,24,25]. This result lends support to the inspiration that
factors other than the abdominal obesity also play a vital
role in the histopathological severity of NASH.
In summary, we observed a strong relationship
between the abdominal obesity and non-alcoholic
steatohepatitis, in particular in the non-obese overweight
and lean patients. Reports of NASH in lean patients are
elusive, because normal BMI does not preclude
abdominal obesity. Accordingly, it is of note to appreciate
and measure the abdominal obesity, the metabolic factor
that correlates best with steatosis and NASH, among
individuals in which overall obesity is relatively
uncommon (lean/overweight but centrally obese
individuals) so as to avoid under-recognition of NASH. In
additon, the importance of the correction of the
abdominal obesity must be emphasized more among the
approaches in the management of NASH. The impact of
abdominal obesity upon NASH in severe obesity is hard
to pin down and seems to decrease due to increae in the
accumulation of the fat in the sites of the body other than
the abdomen. Thus, further studies in patients with
severe obesity are warranted to prove this relationship.
A comparison between the different BMI groups clearly showed that the
trunkal/total fat mass ratio was significantly higher in Group I than in the control group (p <0.01). Trunkal/total body fat mass ratio in Group II
(51.9±3.1%) was comparable with the control group (49.1±6.5%, p>0.05) but, was significantly lower than in group I (54.8±3.6%, p < 0.05).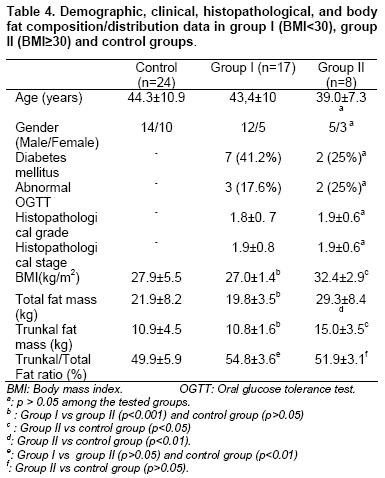
Tartışma
Many studies have pointed to hyperinsulinemia and
insulin resistance as principal pathogenic factors in
NAFLD. Additionally, a strong relationship between liver
fibrosis and components of insulin resistance has been
proposed [7,8,18,19]. Obesity is one of the essential
factors contributing to insulin resistance. Furthermore,
abdominal fat distribution appears to be a leading
predisposing factor for insulin resistance development
even in lean individuals [20] and abdominal fat mass, but
not total fat mass, has been shown to be a predictor of
hepatic steatosis [2,11,21].Figures
References
- Diabetik Hastalarda Serum Selenyum, MDA ve Antioksidant Vitaminlerin (A,E,C) Düzeylerindeki Değişimlerin Değerlendirilmesi
- Early Results of the Implantation of Intravitreal Dexamethasone in the Treatment of Macular Edema due to Diabetic Retinopathy and Retinal Venous Obstruction
- Türk Toplumunda Obezite ve Fazla Kilo Prevalansı ve İlişkili Faktörler